Visualizations and Analytics
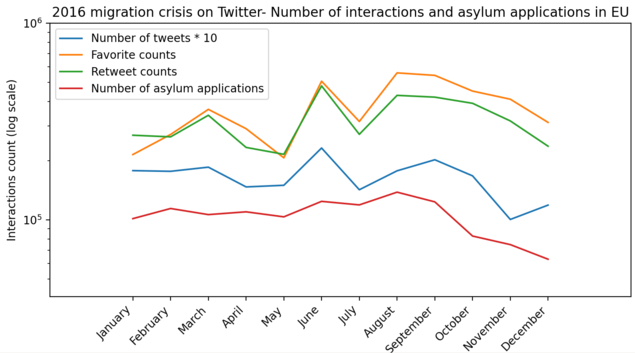
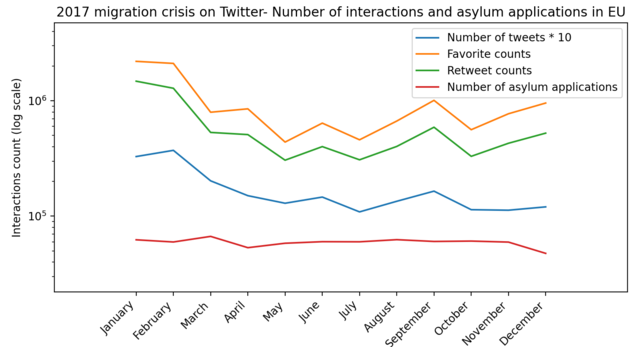
Number of tweets, retweets, favorites, and number of asylum applications
In below graphs, number of monthly tweets, retweets and favorites for years 2016 and 2017 have been plotted. As it is expected these interactions counts follow the same trend. The red plot demonstrates the monthly number of asylum applications registered in EU during the corresponding years. However the number of tweets and asylum applications are not completely correlated, for some months in 2016 it could be seen the tweets count is affected by the applications count. The number of monthly asylum applications in 2017 is almost as half as applications in 2016; nevertheless, number of tweets in the latter year is much higher.
Top 20 entities and hashtags analysis
We first selected top 20 entities and hashtags of whole year 2016. Then they have been ranked and depicted based on their frequencies on a weekly basis. Among top 20 entities, there are 7 entities which do not contain any of our keywords we used to query. For example, Germany and Turkey are two countries and Donald Trump is a politician which co-occurred with our entity and hashtag keywords more often than their counterparts. Germany had the highest number of asylum applications in EU during this time period and Turkey as a transit country hosted the highest number of syrian asylum seekers in 2016. In 2017, many of co-occurred hashtags and entities with our primary keywords are related to US migration policies, including: Executive_order, Deferred_Action_for_Childhood_Arrivals or its equivalent hashtag #daca, as well as #nobannowall, and #muslimban. Syria which had the highest number of asylum applications in EU for both 2016 and 2017, is the only country among the top 20 hashtags in year 2017.
Top 20 Entities in 2016
Top 20 Entities in 2017
Top 20 Hashtags in 2016
Top 20 Hashtags in 2017
Weekly top 100 entities and hashtags
It is possible that an entity or hashtag represents the trending topics on Twitter for only a short time period but they are not among the whole year trending entities and hashtags. Therefore, To visualize entity and hashtag clouds, we took a different approach rather than the previous bar chart race visualizations. Here top 100 entities and hashtags are chosen over the course of each week which consequently leads to more informative visualizations. For example for the hashtag cloud of year 2017 between weeks 4 and 6, hashtags such as #muslimban, #nobannowall, #refugeesdetained, #buildthewall, #notoimmigrationban, #stopiranban, #refugeeban, and #immigrationban are among the hashtags with the highest frequency. These trending hashtags are obviously a response to Trump's executive order banning citizens of seven Muslim-majority countries from entering the United States. This also could explain the sharp increase in number of tweets in number of tweets in the first months of 2017- especially in February- compared to the last months of 2016.
Entity Cloud Evolution
Hashtag Cloud Evolution
Entity Cloud Evolution
Hashtag Cloud Evolution
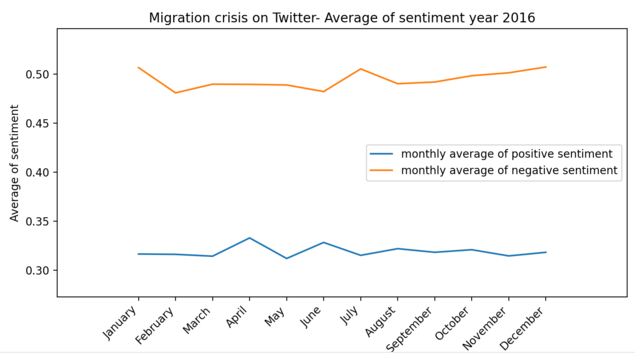
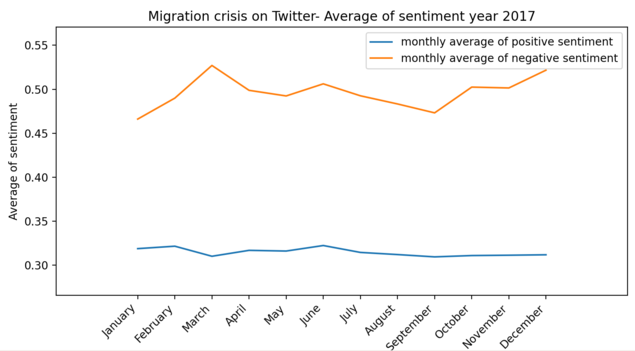
Monthly average of sentiments
Each tweet has both positive and negative sentiment score which are between 0 and 1. To plot the monthly average of sentiments, we did not consider neutral scores. In the sentiment plot for year 2016, the average score for negative sentiments is ranging from 0.48 to 0.51, while for positive sentiments, it is much lower- fluctuating between 0.31 and 0.33. For year 2017, the average score for negative sentiments is ranging from 0.46 to 0.52. Similar to year 2016, average positive sentiment is much lower- fluctuating between 0.31 and 0.32. In general, based on monthly average sentiments for both years it could be interpreted that when it comes to subjective and opinionated tweets, the negative sentiment of tweets towards migrants is much more intense than positive ones.